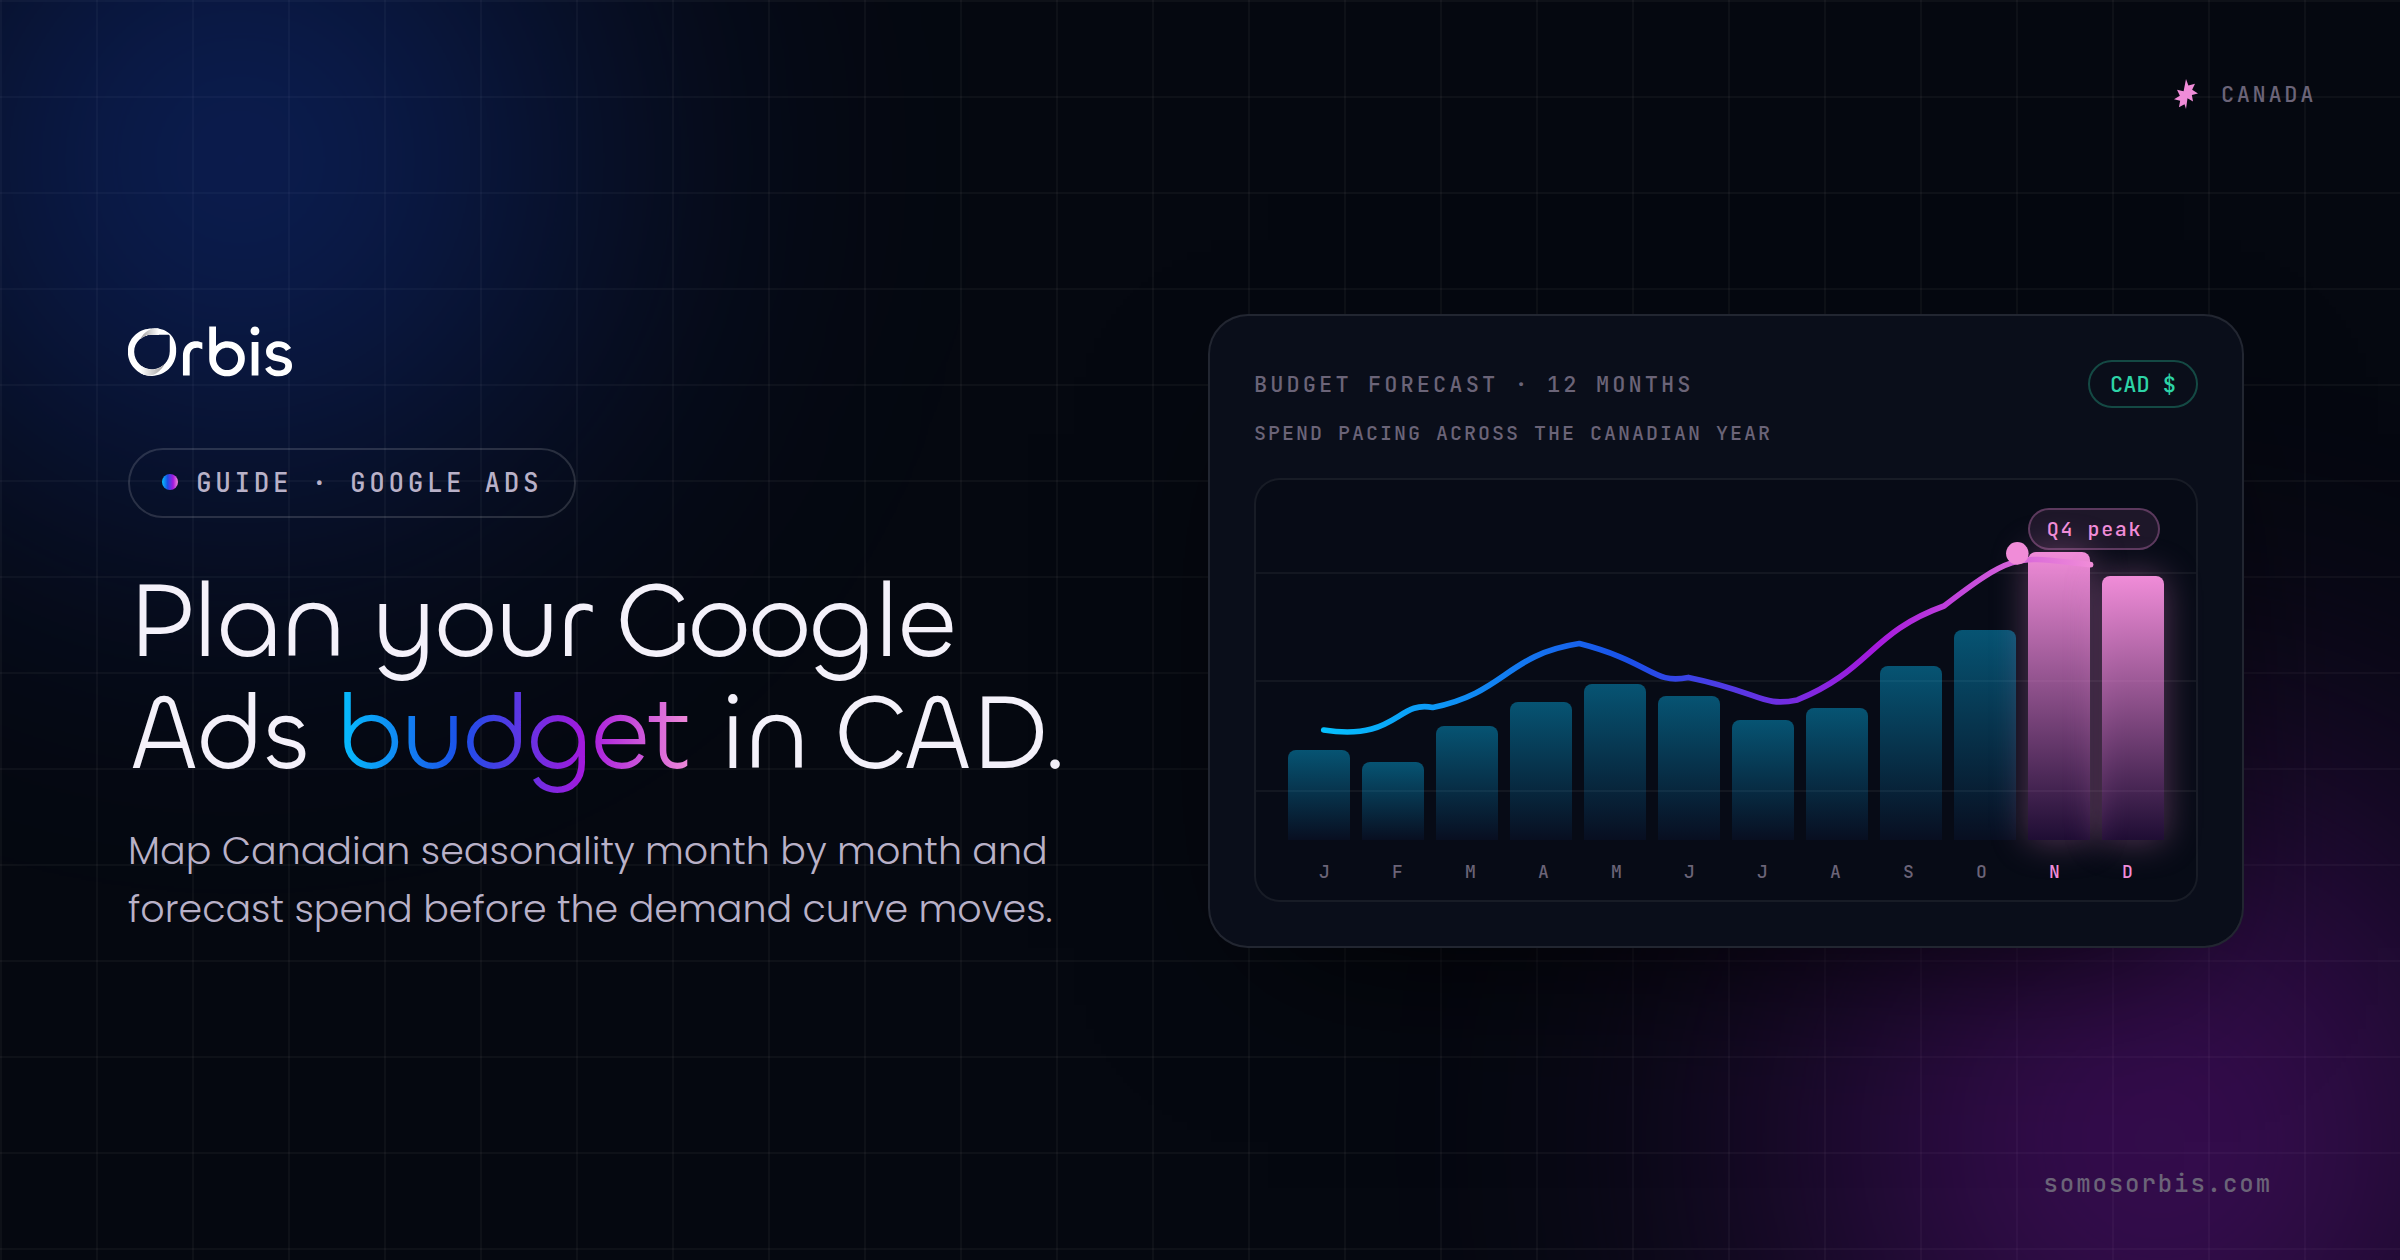
Most Canadian advertisers build their Google Ads budget the same way every year: take last year's annual spend, add a small bump, divide by twelve, and call it a plan. The problem is that demand in Canada does not arrive in twelve equal slices. It clusters around a retail calendar shaped by Canadian holidays, weather, school terms, and tax deadlines. If your CAD budget is flat while demand is seasonal, you overpay during quiet months and run out of budget exactly when shoppers are ready to convert. This guide shows you how to plan a Google Ads budget in Canadian dollars that follows real Canadian seasonality, and how to forecast spend so you are never caught short on Boxing Day or back-to-school.
For a broader foundation on how Search, Shopping, Display and YouTube fit together in the Canadian market, read our complete guide to Google Ads in Canada first. This article goes deeper on one thing only: the money, and when to spend it.
Why a flat monthly budget loses money in Canada
Auction costs and conversion rates move together with demand. When more shoppers search for your product, more competitors raise their bids, cost-per-click climbs, and conversion rates often improve at the same time because intent is higher. A flat budget cannot respond to either side of that movement. Two failure modes follow:
- Budget starvation during peaks. Your campaigns become limited by budget in late November and mid-December, so you lose impression share precisely when each click is most valuable. Google's algorithms throttle delivery, and you cede the auction to competitors who planned ahead.
- Wasted spend during troughs. In low-demand stretches like mid-January or late summer, the same flat daily budget keeps buying clicks that convert at a lower rate, dragging down your blended return.
The fix is not to spend more overall. It is to redistribute the same annual CAD budget so more of it lands in high-return windows and less of it is wasted in low-return ones.
The Canadian retail calendar, month by month
Before you can allocate dollars, you need a shared map of when Canadian demand actually rises and falls. The pattern below holds for most consumer and many B2B categories, though you should always confirm it against your own historical data.
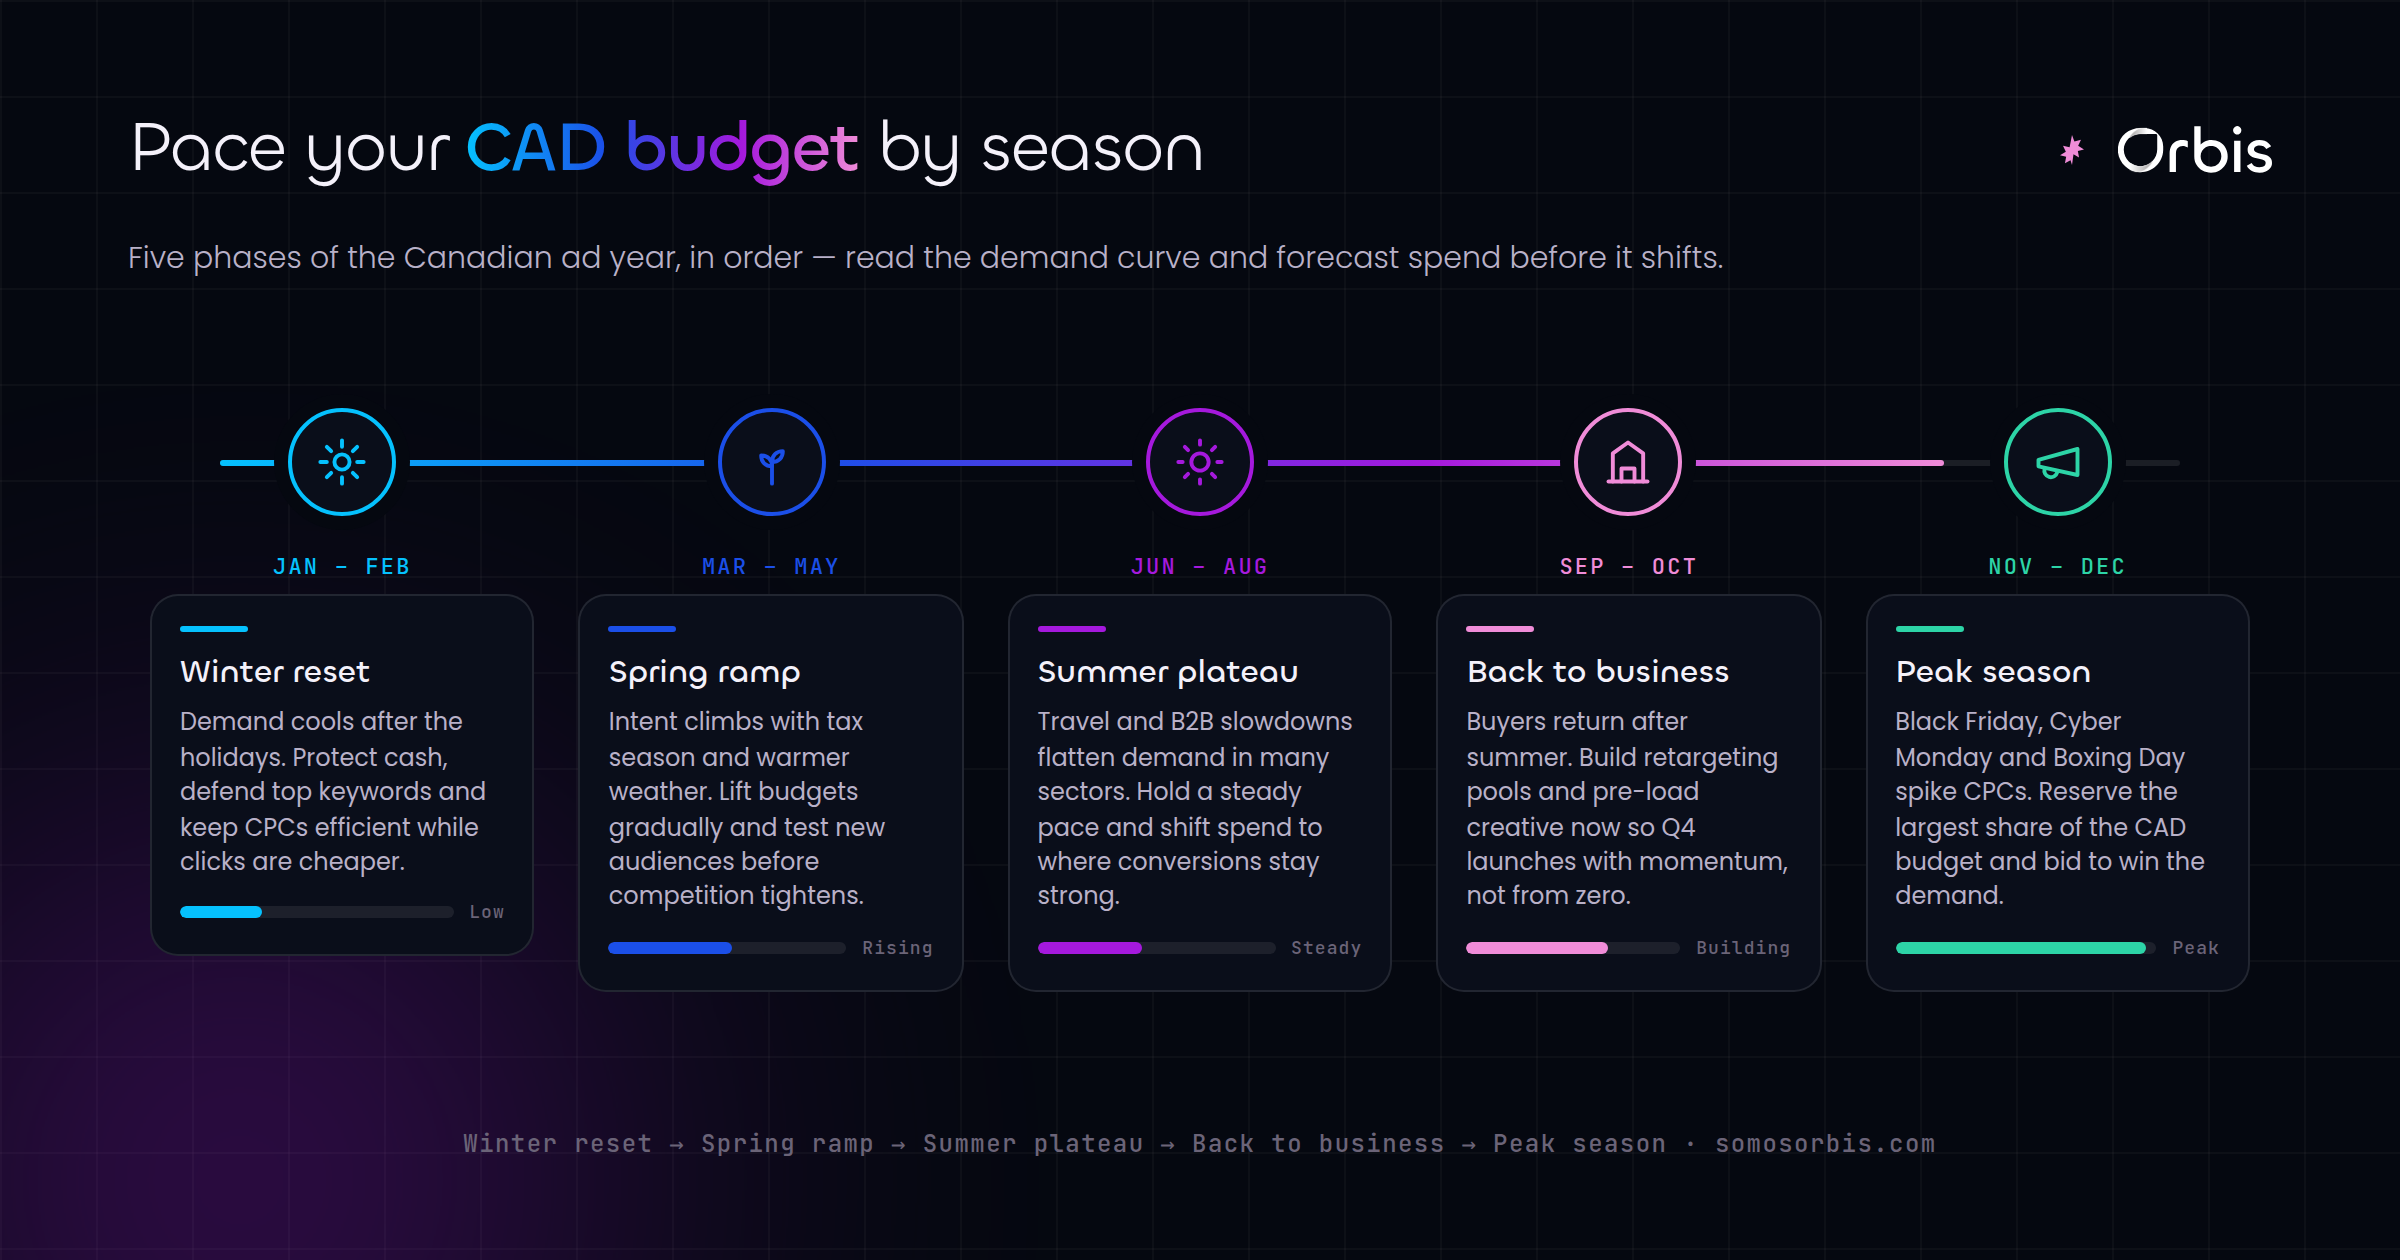
Q1: January to March
- January opens with a sharp post-holiday drop in discretionary spending. Boxing Day and Boxing Week have already pulled forward a lot of demand. Useful for lead-gen, new-year resolution categories (fitness, finance, education), and clearance.
- February is quiet for most, with a Valentine's Day spike for gifting, dining, and travel.
- March brings tax season momentum (the RRSP contribution deadline lands in late February or early March) and March Break travel demand, which varies by province.
Q2: April to June
- April centres on the personal income tax filing deadline (April 30) and the start of spring home, garden, and renovation demand as the weather turns.
- May is strong for home improvement, outdoor, and travel, anchored by the Victoria Day long weekend, which unofficially kicks off the Canadian summer season.
- June carries Father's Day, graduations, and wedding season, plus early summer travel booking.
Q3: July to September
- July opens with Canada Day and summer peak for travel, outdoor, and seasonal retail. Many B2B categories slow as decision-makers take vacation.
- August is dominated by back-to-school, which ramps through the month and is one of Canada's largest retail moments after the winter holidays.
- September sees back-to-school finish, B2B demand return after Labour Day, and the start of fall planning budgets.
Q4: October to December
- October builds with Canadian Thanksgiving (the second Monday) and Halloween, and is when smart advertisers start warming up holiday campaigns.
- November is the single most important month for most retailers: Black Friday and Cyber Monday now stretch into a multi-week event, and CPCs reach their annual high.
- December carries holiday gifting through to last shipping dates, then pivots straight into Boxing Day and Boxing Week, a uniquely Canadian post-Christmas surge that the US calendar does not share.
Build a seasonality index from your own data
National patterns are a starting point, not a budget. Your category, your margins, and your customers will bend the curve. Build your own seasonality index in five steps:
- Pull 24 months of data from Google Ads and Google Analytics 4: conversions, conversion value, cost, and impression share by month. Two years lets you separate a genuine seasonal pattern from a one-off event.
- Calculate each month's share of annual conversion value. If December delivered 14% of your annual revenue, December's index is 1.68 (0.14 divided by the 0.0833 a flat month would get).
- Layer in efficiency. Look at cost-per-acquisition and return on ad spend by month, not just volume. A month can be high-volume but low-margin, or vice versa.
- Flag budget-limited months. Any month where your campaigns showed "limited by budget" status or where lost impression share (budget) exceeded roughly 10% is a month you under-invested. Those are your highest-priority increases.
- Confirm against the Canadian calendar above so you do not mistake a one-time promotion for a recurring seasonal peak.
The output is a multiplier for every month. Multiply your average monthly CAD budget by each month's index, and you have a demand-weighted plan instead of a flat one.
Allocate your annual CAD budget against the curve
Here is a worked example. Suppose you have CAD 120,000 to invest across the year, which averages CAD 10,000 per month. A flat plan spends exactly that every month. A seasonally weighted plan for a typical Canadian retailer might look more like this:
- January–February: dial down to roughly CAD 6,000–7,000 as demand recovers.
- March–June: ramp toward CAD 9,000–11,000 across tax season and the spring home and travel cycle.
- July: hold near CAD 9,000, weighting toward consumer categories.
- August–September: push to CAD 12,000–13,000 for back-to-school and the post-Labour-Day B2B return.
- October: CAD 11,000 to warm up the holiday auctions early and gather conversion data before costs spike.
- November: your largest single allocation, CAD 18,000–22,000, concentrated on Black Friday and Cyber Monday.
- December: CAD 14,000–16,000 spanning holiday gifting and the Boxing Day surge.
The annual total still lands near CAD 120,000. You have simply moved dollars from months that convert poorly into months that convert well. For most Canadian retailers, that reallocation alone improves blended return on ad spend without a single change to creative or targeting.
Reserve a contingency buffer
Hold back 10–15% of your annual budget as an unallocated reserve. Auctions are volatile, a competitor may pull back and leave cheap impression share on the table, and a strong promotion can run hotter than forecast. A reserve lets you press your advantage in real time instead of watching a winning month get throttled by a budget cap.
Plan for peak events specifically
The biggest mistake in Canadian seasonal planning is treating Black Friday as a single day. It is a window, and the dynamics inside that window matter for how you spend.
- Warm up early (late October). Run upper-funnel and remarketing audiences before CPCs peak so your conversion data and audience lists are mature when the auction heats up. Cold campaigns launched on Black Friday morning waste budget learning.
- Protect your branded terms. Competitors bid aggressively on each other's brand names during peaks. Make sure your Google Search Ads campaigns hold the top of the page for your own brand when traffic and intent are highest. If your account structure needs tightening before the rush, our walkthrough on setting up Google Search Ads in Canada covers the campaign settings that matter most.
- Front-load Shopping for retailers. If you sell physical products, your feed quality and bids on Shopping campaigns drive the peak. See our breakdown of Google Shopping for Canadian retailers for feed and bidding specifics that matter most in November and December.
- Do not forget Boxing Day. US-centric playbooks stop at Cyber Monday. In Canada, a meaningful share of holiday revenue lands December 26 through early January. Keep budget in reserve for it.
Account for CAD-specific cost factors
Budgeting in Canadian dollars carries a few wrinkles that US guides ignore:
- Currency on imported inventory. If you source product or services priced in USD, a weaker Canadian dollar squeezes margin, which should lower the CPA you are willing to pay. Revisit target return on ad spend whenever the exchange rate moves materially.
- Bilingual markets. Quebec demand runs on French-language search and a partly different cultural calendar. Budget for French campaigns separately; they often have lower competition and cheaper clicks, but require dedicated creative.
- Regional weather and timing. Spring and patio season arrive weeks later in Calgary or Winnipeg than in Vancouver. If you run national campaigns, geo-segment your seasonal ramps rather than flipping one national switch.
- Provincial holidays. Long weekends differ by province (for example, the August civic holiday is not statutory everywhere). These shift both shopper behaviour and B2B responsiveness.
Forecast next year, then govern it monthly
A budget is a forecast, and a forecast is only useful if you revisit it. Run this cadence:
- Set the annual plan using your seasonality index and the allocation logic above, in CAD, with the contingency reserve carved out.
- Forecast each peak event in detail at least six weeks ahead: target spend, target CPA or ROAS, and the impression share you intend to defend.
- Review monthly against actuals. Compare planned versus actual spend, return, and lost impression share to budget. Reallocate from underperforming months into your reserve or into upcoming peaks.
- Reconcile quarterly. If Q1 came in under budget at strong efficiency, that surplus is fuel for Q4, not a saving to lose.
The advertisers who win Canadian peaks are not the ones who spend the most. They are the ones whose budget arrives in the same shape as their demand.
This is exactly the kind of documented, repeatable process that keeps spend predictable and defensible quarter after quarter, rather than a scramble every November.
Turn your calendar into a plan
Canadian seasonality is predictable enough to plan around and volatile enough to reward those who do. Build your seasonality index from real data, weight your CAD budget toward the months that convert, plan each peak as a window rather than a day, and govern the whole thing with a monthly review. Do that, and your Google Ads spend stops being a flat line fighting a seasonal market.
If you would rather have a team build and run this forecast for you, with documented processes and quarterly governance built in, explore our paid media services for Canadian businesses. We plan budgets in CAD around your retail calendar, defend your peaks, and keep every dollar accountable to revenue.