Most US brands do not have a social media measurement problem. They have a reporting problem. The data exists, the dashboards are full, and the monthly deck has forty slides. Yet when the CFO asks a simple question over a video call from the Dallas headquarters or the New York office, "How much revenue did social drive last quarter?", the room goes quiet. Likes, impressions, and follower counts do not answer that question. They never have.
If your reporting cannot connect a Reels view in Miami to a paying customer, a qualified lead, or measurable brand lift, it is decoration, not measurement. This guide breaks down the social media KPIs that actually matter for US brands in 2026, how to structure reporting so it survives scrutiny from finance, and how to tie social activity to outcomes the business cares about: revenue, leads, and brand value. No vanity metrics, no smoke.
Why Vanity Metrics Keep Winning (and How to Stop Them)
Vanity metrics survive because they are easy to pull and they always go up and to the right. A post got 50,000 impressions. A campaign earned 3,200 likes. Followers grew 8% this month. These numbers feel like progress, and they are comfortable to put in a deck because nobody has to defend them.
The problem is that none of them are tied to a decision. If impressions double next month, what should the business do differently? If they drop 20%, what is at risk? When a metric cannot change a budget, a hire, or a campaign, it is a vanity metric by definition. The discipline of good reporting is asking, before every number goes on a slide, "What decision does this inform?"
Here is the practical filter we apply for clients across retail, services, and B2B:
- Decision test: If this metric moved 30% in either direction, would anyone act? If no, cut it.
- Money test: Can this metric be traced, directly or through a documented assumption, to revenue, pipeline, or cost saved?
- Trend test: Is a single month meaningful, or do you only learn something across a quarter or a US seasonal cycle?
Metrics that fail all three belong in an appendix, not the headline. This single rule eliminates most of the noise that buries real signal in US social reporting.
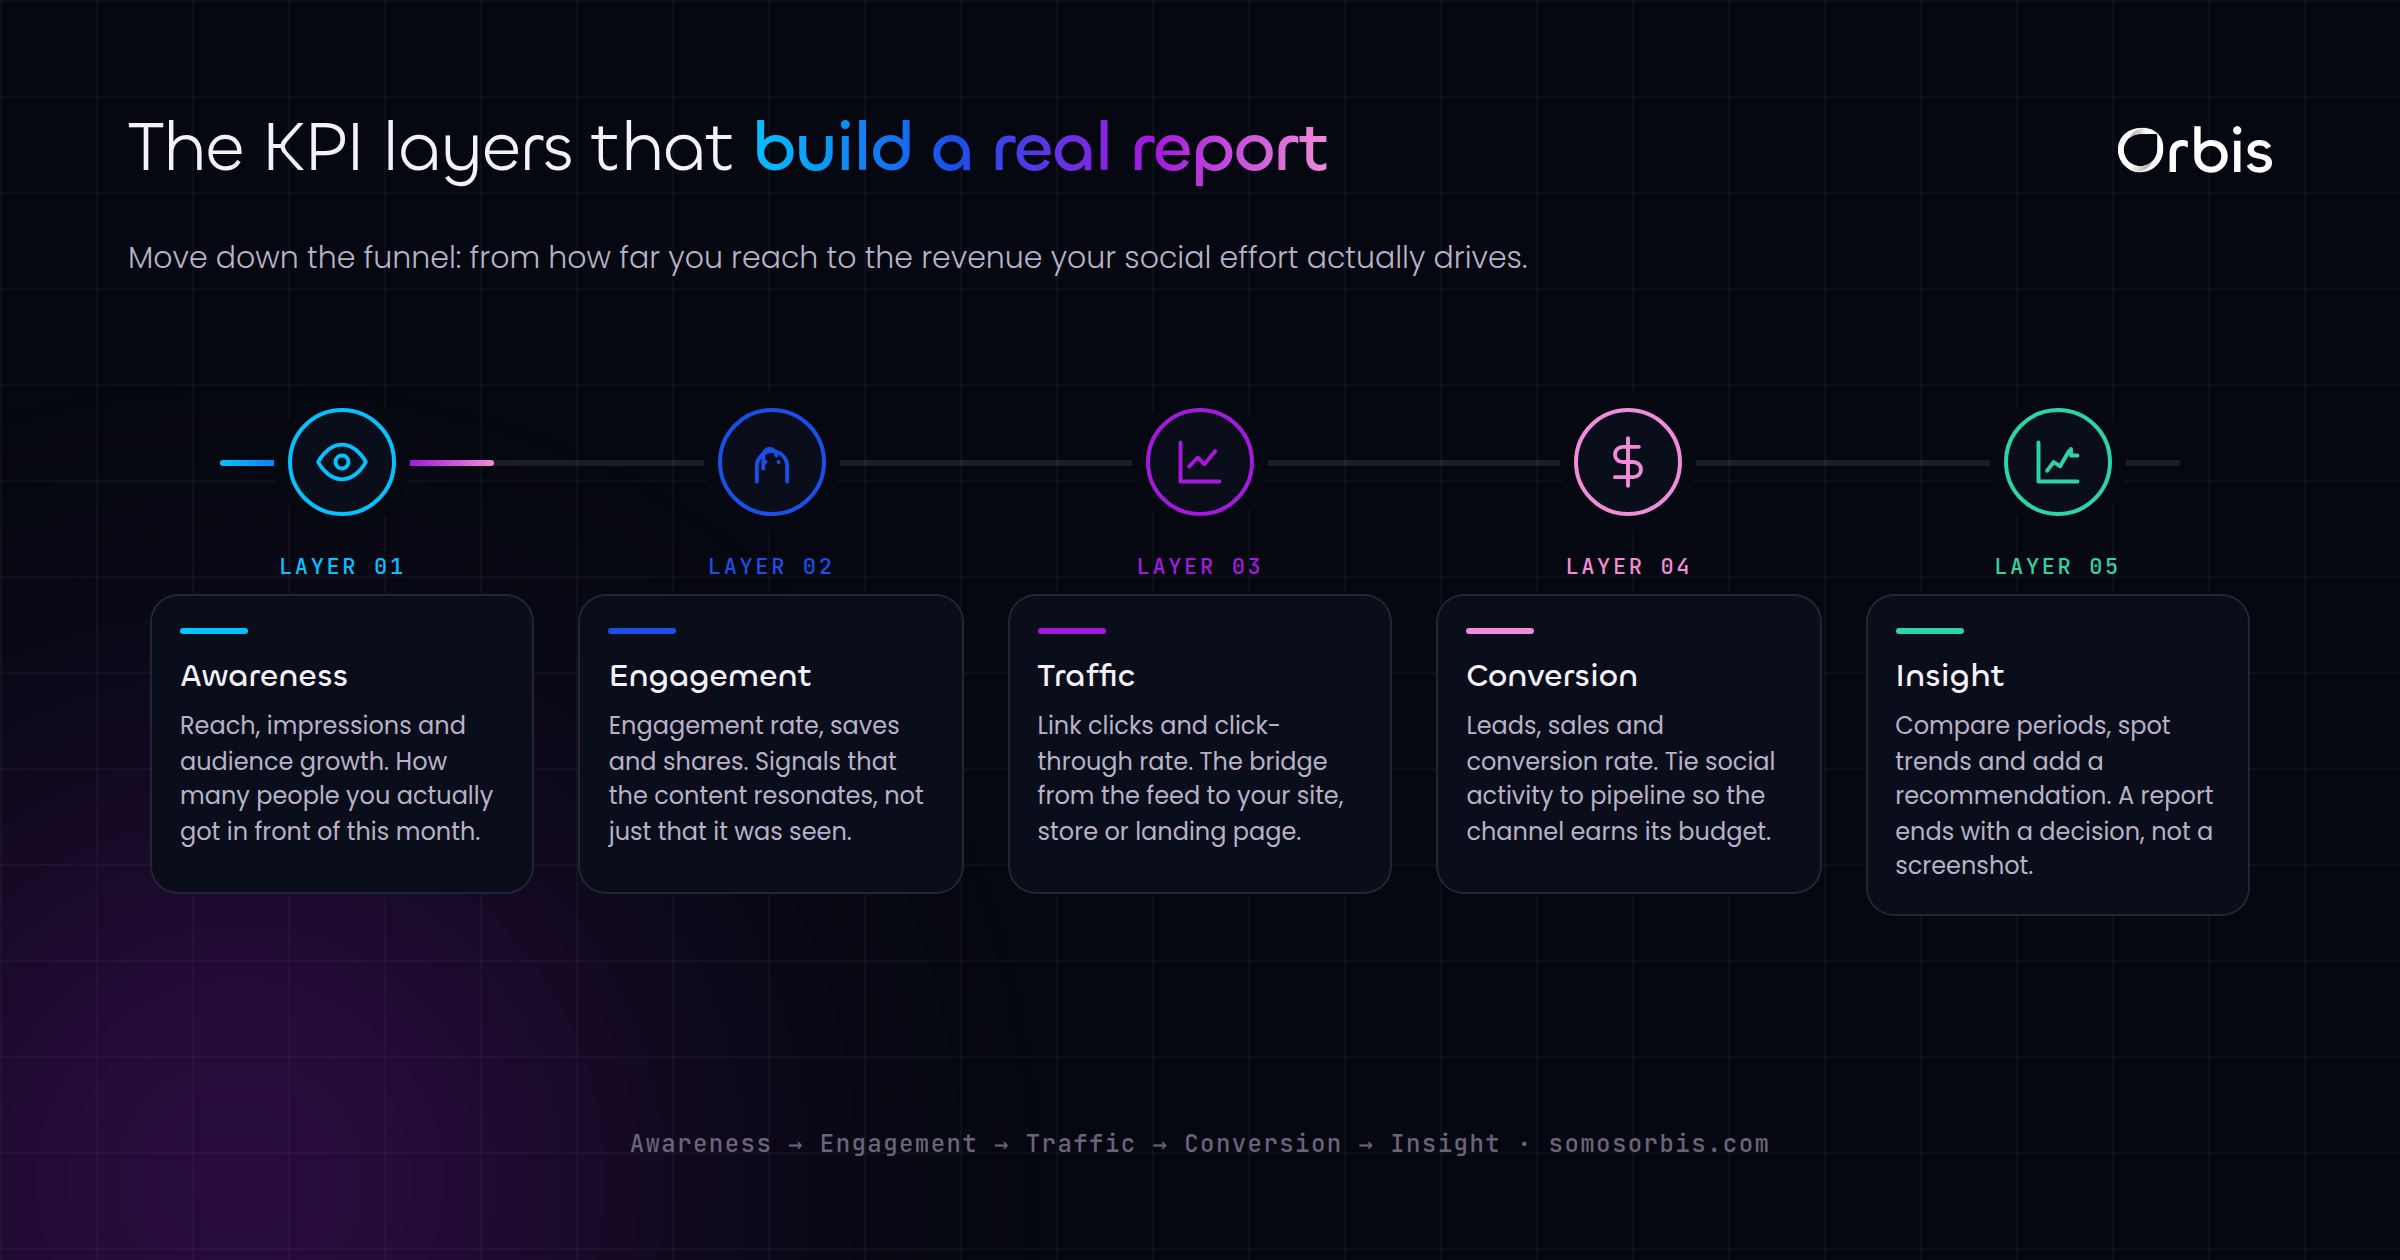
The Three Layers of Social KPIs That Matter
Effective social reporting works in layers, each answering a different stakeholder. Mixing them is where decks fall apart. The community manager cares about engagement quality; the marketing director cares about pipeline contribution; the CFO cares about revenue and efficiency. Build the report so each layer rolls up cleanly into the next.
Layer 1: Engagement Quality (the leading indicators)
These are not vanity metrics when used correctly. They are early signals that predict downstream outcomes weeks before revenue shows up. The mistake is treating them as the destination instead of the on-ramp.
- Engagement rate by reach: Interactions divided by accounts reached, not by follower count. This normalizes across platforms and audience sizes, so a Chicago boutique with 4,000 followers can be compared fairly to a national brand.
- Save and share rate: On Instagram and TikTok, saves and shares signal intent and value far better than likes. A high save rate on a product post in October often predicts Black Friday and Cyber Monday demand.
- Comment sentiment: Volume of comments matters less than the ratio of buying-intent comments ("Where do I get this?", "Price?", "Ships to LA?") to noise.
- Profile-to-action rate: Of the people who hit your profile from a post, how many click the link in bio or DM you? This is the bridge from awareness to your owned funnel.
Layer 2: Traffic and Lead Contribution (the connective tissue)
This is where most reporting collapses, because it requires connecting social to the website and CRM. It is also where social earns or loses its budget. The non-negotiables:
- Social-sourced sessions and their quality: Not just how many visits social drove, but bounce rate, pages per session, and time on site versus other channels. Cheap traffic that bounces is not a win.
- Lead volume and cost per lead by platform: Track form fills, demo requests, and DMs that turn into conversations, attributed back to the originating platform and campaign in USD.
- Lead quality score: A lead from a national back-to-school campaign and a lead from a niche B2B thought-leadership post are not equal. Tag and score them so the report shows qualified pipeline, not raw counts.
- Assisted conversions: Social rarely closes the deal on the last click, especially for considered purchases. Use a model that credits social for its role earlier in the journey instead of letting last-click attribution erase it.
Layer 3: Revenue and Brand Outcomes (what finance signs off on)
This is the layer that ends the awkward CFO silence. It speaks the language of the P&L.
- Social-attributed revenue: Revenue from social-sourced and social-assisted conversions, reported in USD with the attribution method documented so it survives an audit.
- Return on ad spend (ROAS) and blended ROAS: For paid social, ROAS per campaign; blended ROAS across paid and organic to show the true picture during high-spend windows like Amazon Prime Day or the holidays.
- Customer acquisition cost (CAC) by channel: What does a social-acquired customer cost versus search or email? This decides where the next marketing dollar goes.
- Brand lift: Branded search volume, direct traffic, and survey-based awareness in your target markets. When social is working, people in Houston start Googling your brand by name.
How to Tie Social Activity to Revenue (Without Faking It)
Attribution is where reporting credibility is won or lost. Overclaim and finance stops trusting you; underclaim and your budget gets cut. The honest path is documented, defensible measurement. This is part of what we call Revenue Engineering: building the plumbing so marketing activity maps to money in a way that holds up.
Set up tracking before the campaign, not after
You cannot measure what you did not instrument. Before any campaign goes live:
- Apply consistent UTM parameters to every social link, with a naming convention everyone follows so reports do not fracture into "facebook," "FB," and "Facebook_ad."
- Set up conversion events and offline conversion imports so in-store or sales-team-closed deals trace back to social touchpoints.
- Connect your social platforms to your CRM so lead source is captured automatically, not typed in by a rep three days later.
- Handle consent and tracking choices cleanly. US privacy expectations mean honoring opt-outs and respecting user choices in your data collection. Build measurement that works within those rules rather than around them, what we call Compliance by Design.
Choose an attribution model and disclose it
There is no perfect attribution model, only models with known trade-offs. Last-click undercredits social. First-click overcredits the discovery channel. The point is not perfection, it is consistency and transparency.
The most trustworthy social report is not the one with the biggest revenue number. It is the one where every number can be traced to its source and the method is written down where finance can read it.
Pick a model, state it on the report ("Revenue attributed using a position-based model crediting first and last touch"), and keep it stable so month-over-month comparisons mean something. When you change models, annotate it. Documented, repeatable process is the difference between a report finance trusts and a report finance ignores.
Building a Report That Survives the C-Suite
A report that gets acted on follows a structure, not a data dump. After auditing dozens of US social programs, the pattern that works looks like this:
- One headline outcome up top: The single most important number this period (social-attributed revenue or qualified pipeline), with the comparison to last period and to target.
- The three layers, in order: Revenue and brand first, then lead contribution, then engagement quality as supporting evidence, not the lead story.
- Context for every number: A 12% drop in engagement during tax season or post-holiday lull is expected, not a crisis. Annotate seasonality so US stakeholders read the numbers correctly.
- One clear recommendation: Every report should end with what you are going to do differently next period and what you need to do it.
Cadence matters too. Weekly check-ins for the team to steer in-flight, monthly for the marketing leadership, quarterly for the board. The board deck is not the monthly deck with more slides; it is the monthly deck with fewer, focused on trend and outcome.
Reporting around the US calendar
US seasonality is not a footnote, it is the frame. A program judged on raw monthly numbers will look broken every January and heroic every November. Build benchmarks against the relevant period last year, not the previous month:
- Q4 (Black Friday, Cyber Monday, holidays): Expect higher spend and ROAS pressure; report blended efficiency, not just peak-day spikes.
- Mid-summer (Amazon Prime Day): A demand window even for non-Amazon brands riding the shopping mindset.
- Late summer (back-to-school): Strong for retail, family, and education-adjacent brands.
- Q1 (tax season, post-holiday): Softer engagement is normal; this is the window for brand-building, not panic.
Reaching the US Hispanic Market in Your Reporting
The US Hispanic market is one of the largest and fastest-growing consumer segments in the country, and most social reports ignore it entirely. If you run bilingual EN/ES content or target markets like Miami, Los Angeles, Houston, or Chicago with Spanish-language creative, your reporting should segment it. Blending bilingual performance into one average hides what is often your highest-engagement, highest-ROI audience.
- Report engagement and conversion separately for English and Spanish creative so you can see which resonates where.
- Track which markets respond to bilingual content; the answer often reshapes where you invest next quarter.
- Watch sentiment and share rates in Spanish-language comments as a leading indicator of community strength.
Segmenting this audience is not a nice-to-have. It is often where the clearest growth story in the whole report lives.
From Report to Action: Closing the Loop
A report nobody acts on is overhead. The final discipline is the feedback loop: every reporting cycle should produce a short list of decisions. Double down on the content format with the highest save-to-conversion rate. Cut the platform with the worst lead quality. Shift spend toward the audience segment with the lowest CAC. Reporting that does not change what you do next is just record-keeping.
This is exactly the gap we close for US brands: not more dashboards, but reporting and optimization that connects social activity to revenue and tells you what to do about it. If your social numbers look healthy but nobody can say what they are worth, our team can build the measurement framework and the optimization process that fixes it. Start with our social media reporting and optimization service to turn your data into decisions, and into revenue.
Related Guides
This article is part of our broader social media resource set for US brands. To put these KPIs into a complete program, start with the pillar guide and the audit companion:
- The Complete Social Media Strategy Guide for US Brands in 2026, the full framework that this reporting layer plugs into.
- Social Media Audit Checklist for US Brands, to make sure the accounts and tracking you are reporting on are actually set up right.
Get the measurement right, and social stops being the channel nobody can defend. It becomes the one with the clearest line to revenue, and the easiest budget conversation you will have all year.